Display
432.3K
Ad views
Across the national and regional publications Rhode Island reads every day.

From June 5 to September 4, 2026, Compass and Lila Delman Compass advertised across Google, Meta, and geofenced venues throughout Rhode Island, reaching UHNW summer residents, second homeowners, and feeder market buyers.
Rhode Island's wealthiest saw Compass and Lila Delman ads all summer, and searches that showed those ads nearly tripled by September. One in five people who searched either brand by name clicked through, and across every channel, the Rhode Island collection earned 9,300 visits.
Month 1 seeded the summer, reaching buyers as they arrived ahead of the season. Month 2 built recognition at the height of the season, with the budget shifted toward the consumer channels. Month 3 concentrated delivery behind the creative that had already proven itself as the season closed, and reached more of Rhode Island than either month before it.
Google display, Meta, geofencing, and Google search worked side by side for all three months, covering the news Rhode Island buyers read, their feeds, the places they pass through, and what they search. Every channel exceeded our national benchmarks.
Across the national and regional publications Rhode Island reads every day.
Across Facebook and Instagram, in the feeds and Reels Rhode Island scrolls.
Across the coastal venues and travel hubs Rhode Island buyers pass through.
When Rhode Island searched Compass or Lila Delman.
The campaign was built so that when a coastal buyer thinks Rhode Island real estate, Compass and Lila Delman are their first and only call. The targeting followed buyers throughout the summer: households touring the Gilded Age mansions, members of the New York Yacht Club and Newport Country Club, and guests at Ocean House and the Weekapaug Inn.
| 69.5K | |
| 29.9K | |
| 27.6K | |
| 22.0K | |
| 21.7K | |
| 20.8K |
| 10.5K | |
| 10.2K | |
| 4.2K | |
| 3.8K | |
| 2.6K | |
| 2.5K |
When a Rhode Island buyer read the national press, both brands were there.
Across Facebook and Instagram, Rhode Island summer buyers saw Compass and Lila Delman ads 75.4K times over three months. Meta found the people who matched the campaign's wealth, travel, and luxury coastal signals, then showed the ads to more people like them.
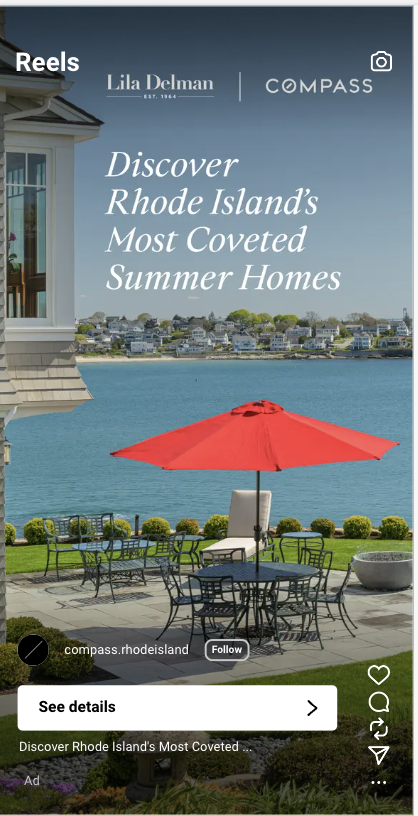
The June ad in Instagram Reels
"Discover Rhode Island's Most Coveted Summer Homes," the co-branded ad that opened the summer, earned 2.1K link clicks on 33.1K ad views, a 6.37% engagement rate. "Rhode Island's Most Exclusive Addresses," the Compass-only ad added July 27, earned 1.2K more on 26.7K views. Between them, one idea received 87% of Meta's link clicks: Rhode Island's most coveted homes, and the brokerage that lists them. Across every ad, the channel's engagement rate came in at 5.64%, 4.9 times the 1.16% Meta benchmark.
| Ad | Ad Views | Accounts Reached | Clicks | Engagement Rate |
|---|---|---|---|---|
| Discover Rhode Island's Most Coveted Summer Homes | 33.1K | 25.3K | 2.1K | 6.37% |
| Rhode Island's Most Exclusive Addresses | 26.7K | 20.7K | 1.2K | 4.39% |
| Explore Rhode Island's Most Sought-After Homes | 5.7K | 4.6K | 301 | 5.27% |
Through August 4, Instagram delivered 81% of Meta's ad views and 86% of its clicks, and Reels alone received two-thirds of both views and clicks. Feed and Stories had the highest engagement rates with fewer views. The Rhode Island summer audience is watching short-form video, and the campaign met them there.
The agent campaigns, and why they came down. Compass and Lila Delman Compass each showed a brand awareness campaign to its own agent roster through Month 1, reaching 22 profiles combined. Both lists had emails only, and Meta matches a contact list far better with phone numbers attached, so Month 2 moved that budget into the consumer campaign. A roster export with phone numbers would let both brands stay in front of their own agents for a full summer.
Geofencing was the campaign's precision play. Display, search, and Meta met buyers online; geofencing started with where buyers went offline. The campaign drew digital fences around 39 of the places Rhode Island's summer buyer passes through, from the Newport mansions, Bannister's Wharf, and Ocean House to the airports and rail hubs that feed the coast.
Logan Airport alone delivered 19.2K of the campaign's 20.0K geofencing ad views. A traveler who passed through Logan on the way to a Rhode Island summer saw both brands on their phone for weeks afterward. South Station, T.F. Green, and Bradley followed, and the coastal venues added the rest. Overall geofencing engagement rate came in at 0.13%, inside the 0.10% to 0.25% healthy range for location-based awareness campaigns.
The real-estate category benchmark for Google Search sits around 4.5%. This campaign reached 8.05%, and the branded searches went higher still.
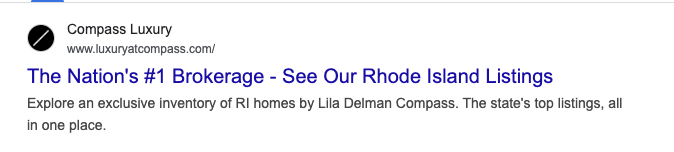
The highest-engaging search ad, as Rhode Island saw it: 430 clicks on 4.9K ad views, an 8.85% engagement rate.
Across every Compass and Lila Delman term, 17.4% of the people who saw the ad clicked it, and when people searched either brand by name, 20.3% clicked, a sign Rhode Island already knows both names and goes looking for them. Rhode Island real estate, the broadest term, had the most volume at 7.4K ad views and 469 clicks, and Newport RI homes followed at 162 clicks.
June 5 to September 4 · Targeting Rhode Island searchers| Keyword | Ad Views | Clicks | Engagement Rate |
|---|---|---|---|
| Rhode Island real estate | 7.4K | 469 | 6.4% |
| Newport RI homes | 1.9K | 162 | 8.5% |
| Compass Real Estate Rhode Island | 739 | 124 | 16.8% |
| Rhode Island luxury homes | 897 | 76 | 8.5% |
| Lila Delman Compass | 390 | 72 | 18.5% |
| Newport mansions for sale | 344 | 26 | 7.6% |
| Rhode Island luxury real estate | 175 | 22 | 12.6% |
| Watch Hill homes for sale | 239 | 18 | 7.5% |
| Lila Delman Compass Newport | 73 | 13 | 17.8% |
| Block Island homes | 81 | 2 | 2.5% |
Display averaged a 0.92% engagement rate, more than five times the 0.18% national average. Rhode Island buyers clicked often enough that Google did not have to show the ads as many times to earn each click.
The campaign ran two waves of creative. "This Summer, Find Your Place in Rhode Island" and "Rhode Island Summers Look Better in Your Own Home" opened the summer in June. Three new lines joined on July 27: "Your Rhode Island Summer Starts Here," "Rhode Island's Most Exclusive Addresses," and "Explore Rhode Island's Most Sought-After Homes."
Every ad beat the 0.18% national average, so Month 3 put the budget behind the July lines. The July ads earned a 0.96% engagement rate, and the June ads earned 0.89%.
Each tagline ran in a Compass version and a Lila Delman Compass version, and every ad carried its listing's own logo, so the brand a buyer saw matched the home in the ad.
Winners ranked by clicks at volume across all three months, from the Google Ads source. Compass national display benchmark is 0.18%.
| Creative | Format | Clicks | Ad Views | Engagement Rate |
|---|---|---|---|---|
 This Summer, Find Your Place in Rhode Island This Summer, Find Your Place in Rhode Island | Standard | 1.5K | 187.9K | 0.78% |
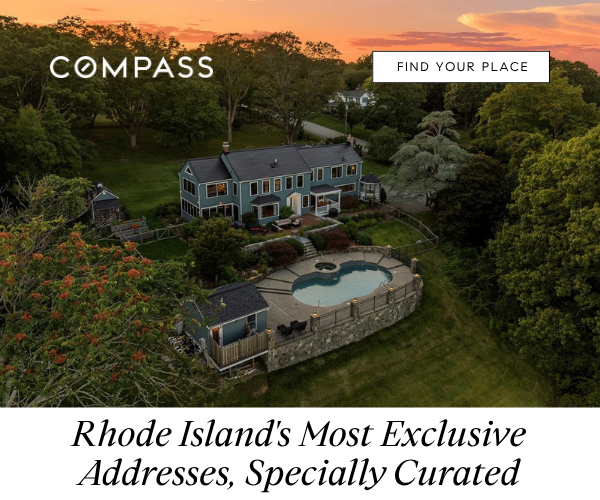 Rhode Island's Most Exclusive Addresses Rhode Island's Most Exclusive Addresses | Standard | 775 | 90.8K | 0.85% |
 Your Rhode Island Summer Starts Here Your Rhode Island Summer Starts Here | Standard | 463 | 54.8K | 0.84% |
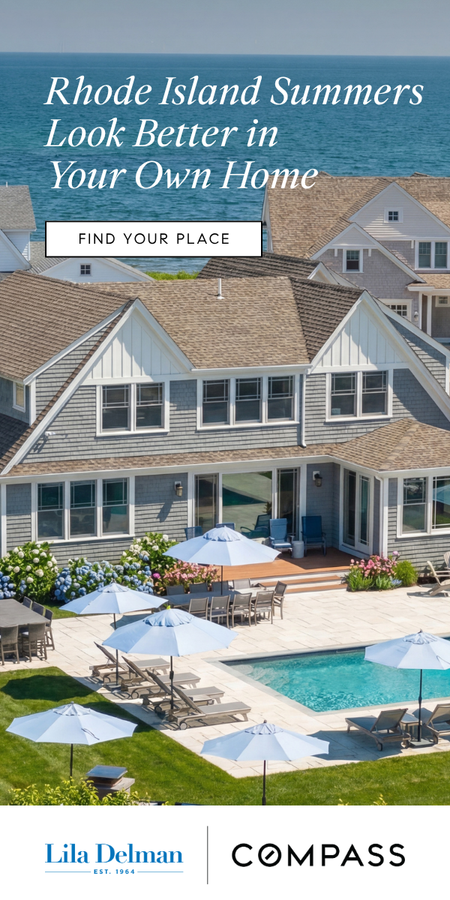 Rhode Island Summers Look Better in Your Own Home Rhode Island Summers Look Better in Your Own Home | Vertical | 408 | 28.9K | 1.41% |
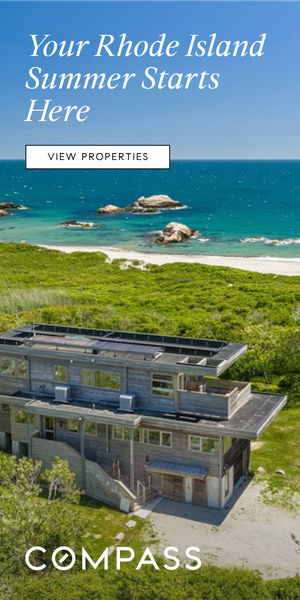 Your Rhode Island Summer Starts Here Your Rhode Island Summer Starts Here | Vertical | 207 | 16.5K | 1.25% |
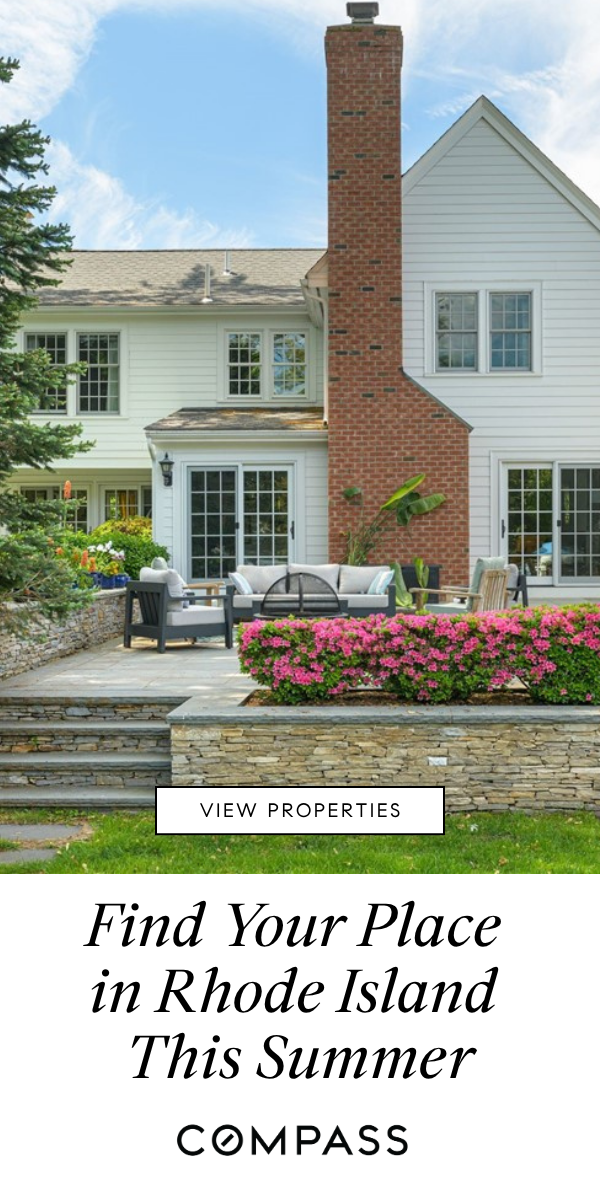 This Summer, Find Your Place in Rhode Island This Summer, Find Your Place in Rhode Island | Vertical | 172 | 13.4K | 1.28% |
 Explore Rhode Island's Most Sought-After Homes Explore Rhode Island's Most Sought-After Homes | Standard | 156 | 12.6K | 1.24% |
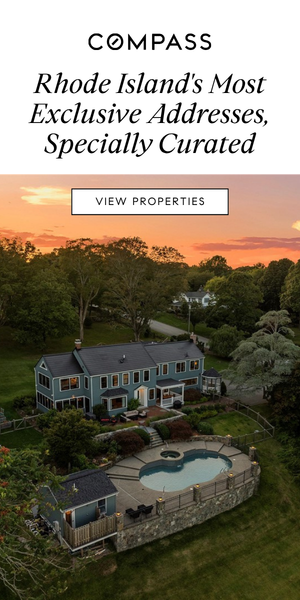 Rhode Island's Most Exclusive Addresses Rhode Island's Most Exclusive Addresses | Vertical | 130 | 7.5K | 1.72% |
 Rhode Island Summers Look Better in Your Own Home Rhode Island Summers Look Better in Your Own Home | Standard | 64 | 7.5K | 0.85% |
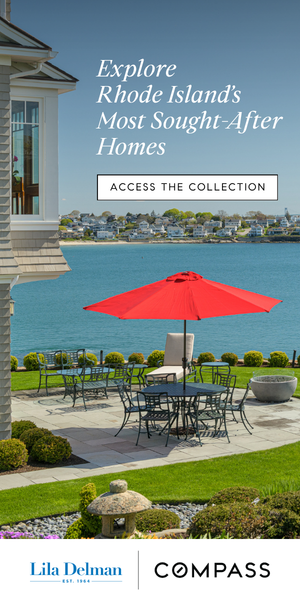 Explore Rhode Island's Most Sought-After Homes Explore Rhode Island's Most Sought-After Homes | Vertical | 60 | 5.6K | 1.07% |
 Discover Rhode Island's Most Coveted Summer Homes Discover Rhode Island's Most Coveted Summer Homes | Standard | 35 | 4.7K | 0.75% |
 Discover Rhode Island's Most Coveted Summer Homes Discover Rhode Island's Most Coveted Summer Homes | Vertical | 25 | 2.0K | 1.24% |
Rows combine the Compass and Lila Delman Compass versions of each tagline, and the image variants that used the same line.
Vertical beat its standard counterpart on engagement rate in five of six matched pairings. "Rhode Island's Most Exclusive Addresses" earned 1.72% vertical and 0.85% standard, and "Rhode Island Summers Look Better in Your Own Home" earned 1.41% vertical and 0.85% standard. The standard formats brought the volume, and the vertical formats brought the higher engagement rates.
Reading the engagement rates. Vertical units earn higher engagement rates in part because they take up more of the page and because Google has less inventory for them, so they serve less often.
"This Summer, Find Your Place in Rhode Island" earned 1.6K clicks across both formats, the most of any display line, and the two "most coveted" and "most exclusive" lines received 87% of Meta's clicks. A 2027 build starts from those two ideas: an invitation to find a place for the summer, and naming its most coveted addresses.
Logan Airport delivered 96% of the channel's ad views, and the three other hubs delivered most of the rest. A fence captures a device only when someone inside it opens an app, and the coastal venues see a fraction of an airport's foot traffic. A 2027 build fences the hubs buyers travel through and pairs them with the two or three coastal venues that drew the most visitors this summer.
| Channel | Ad Views | Clicks | Engagement Rate |
|---|---|---|---|
| Google Display | 102.2K | 921 | 0.90% |
| Meta | 20.4K | 989 | 4.85% |
| Google Search | 2.4K | 230 | 9.56% |
| Geofencing | 7.4K | 10 | 0.13% |
| Channel | Ad Views | Clicks | Engagement Rate |
|---|---|---|---|
| Google Display | 145.4K | 1.4K | 0.95% |
| Meta | 30.7K | 1.7K | 5.57% |
| Google Search | 3.6K | 319 | 8.86% |
| Geofencing | 7.5K | 9 | 0.12% |
| Channel | Ad Views | Clicks | Engagement Rate |
|---|---|---|---|
| Google Display | 184.7K | 1.7K | 0.90% |
| Meta | 24.3K | 1.6K | 6.4% |
| Google Search | 6.5K | 458 | 7.03% |
| Geofencing | 5.1K | 8 | 0.16% |
Month 2 and Month 3 channel rows are approximate, derived from the campaign totals and the prior monthly reports.